Raise a Child
2024 / Co-PRODUCT DESIGNER
Helping nonprofit admins manage and visualize constituent data.
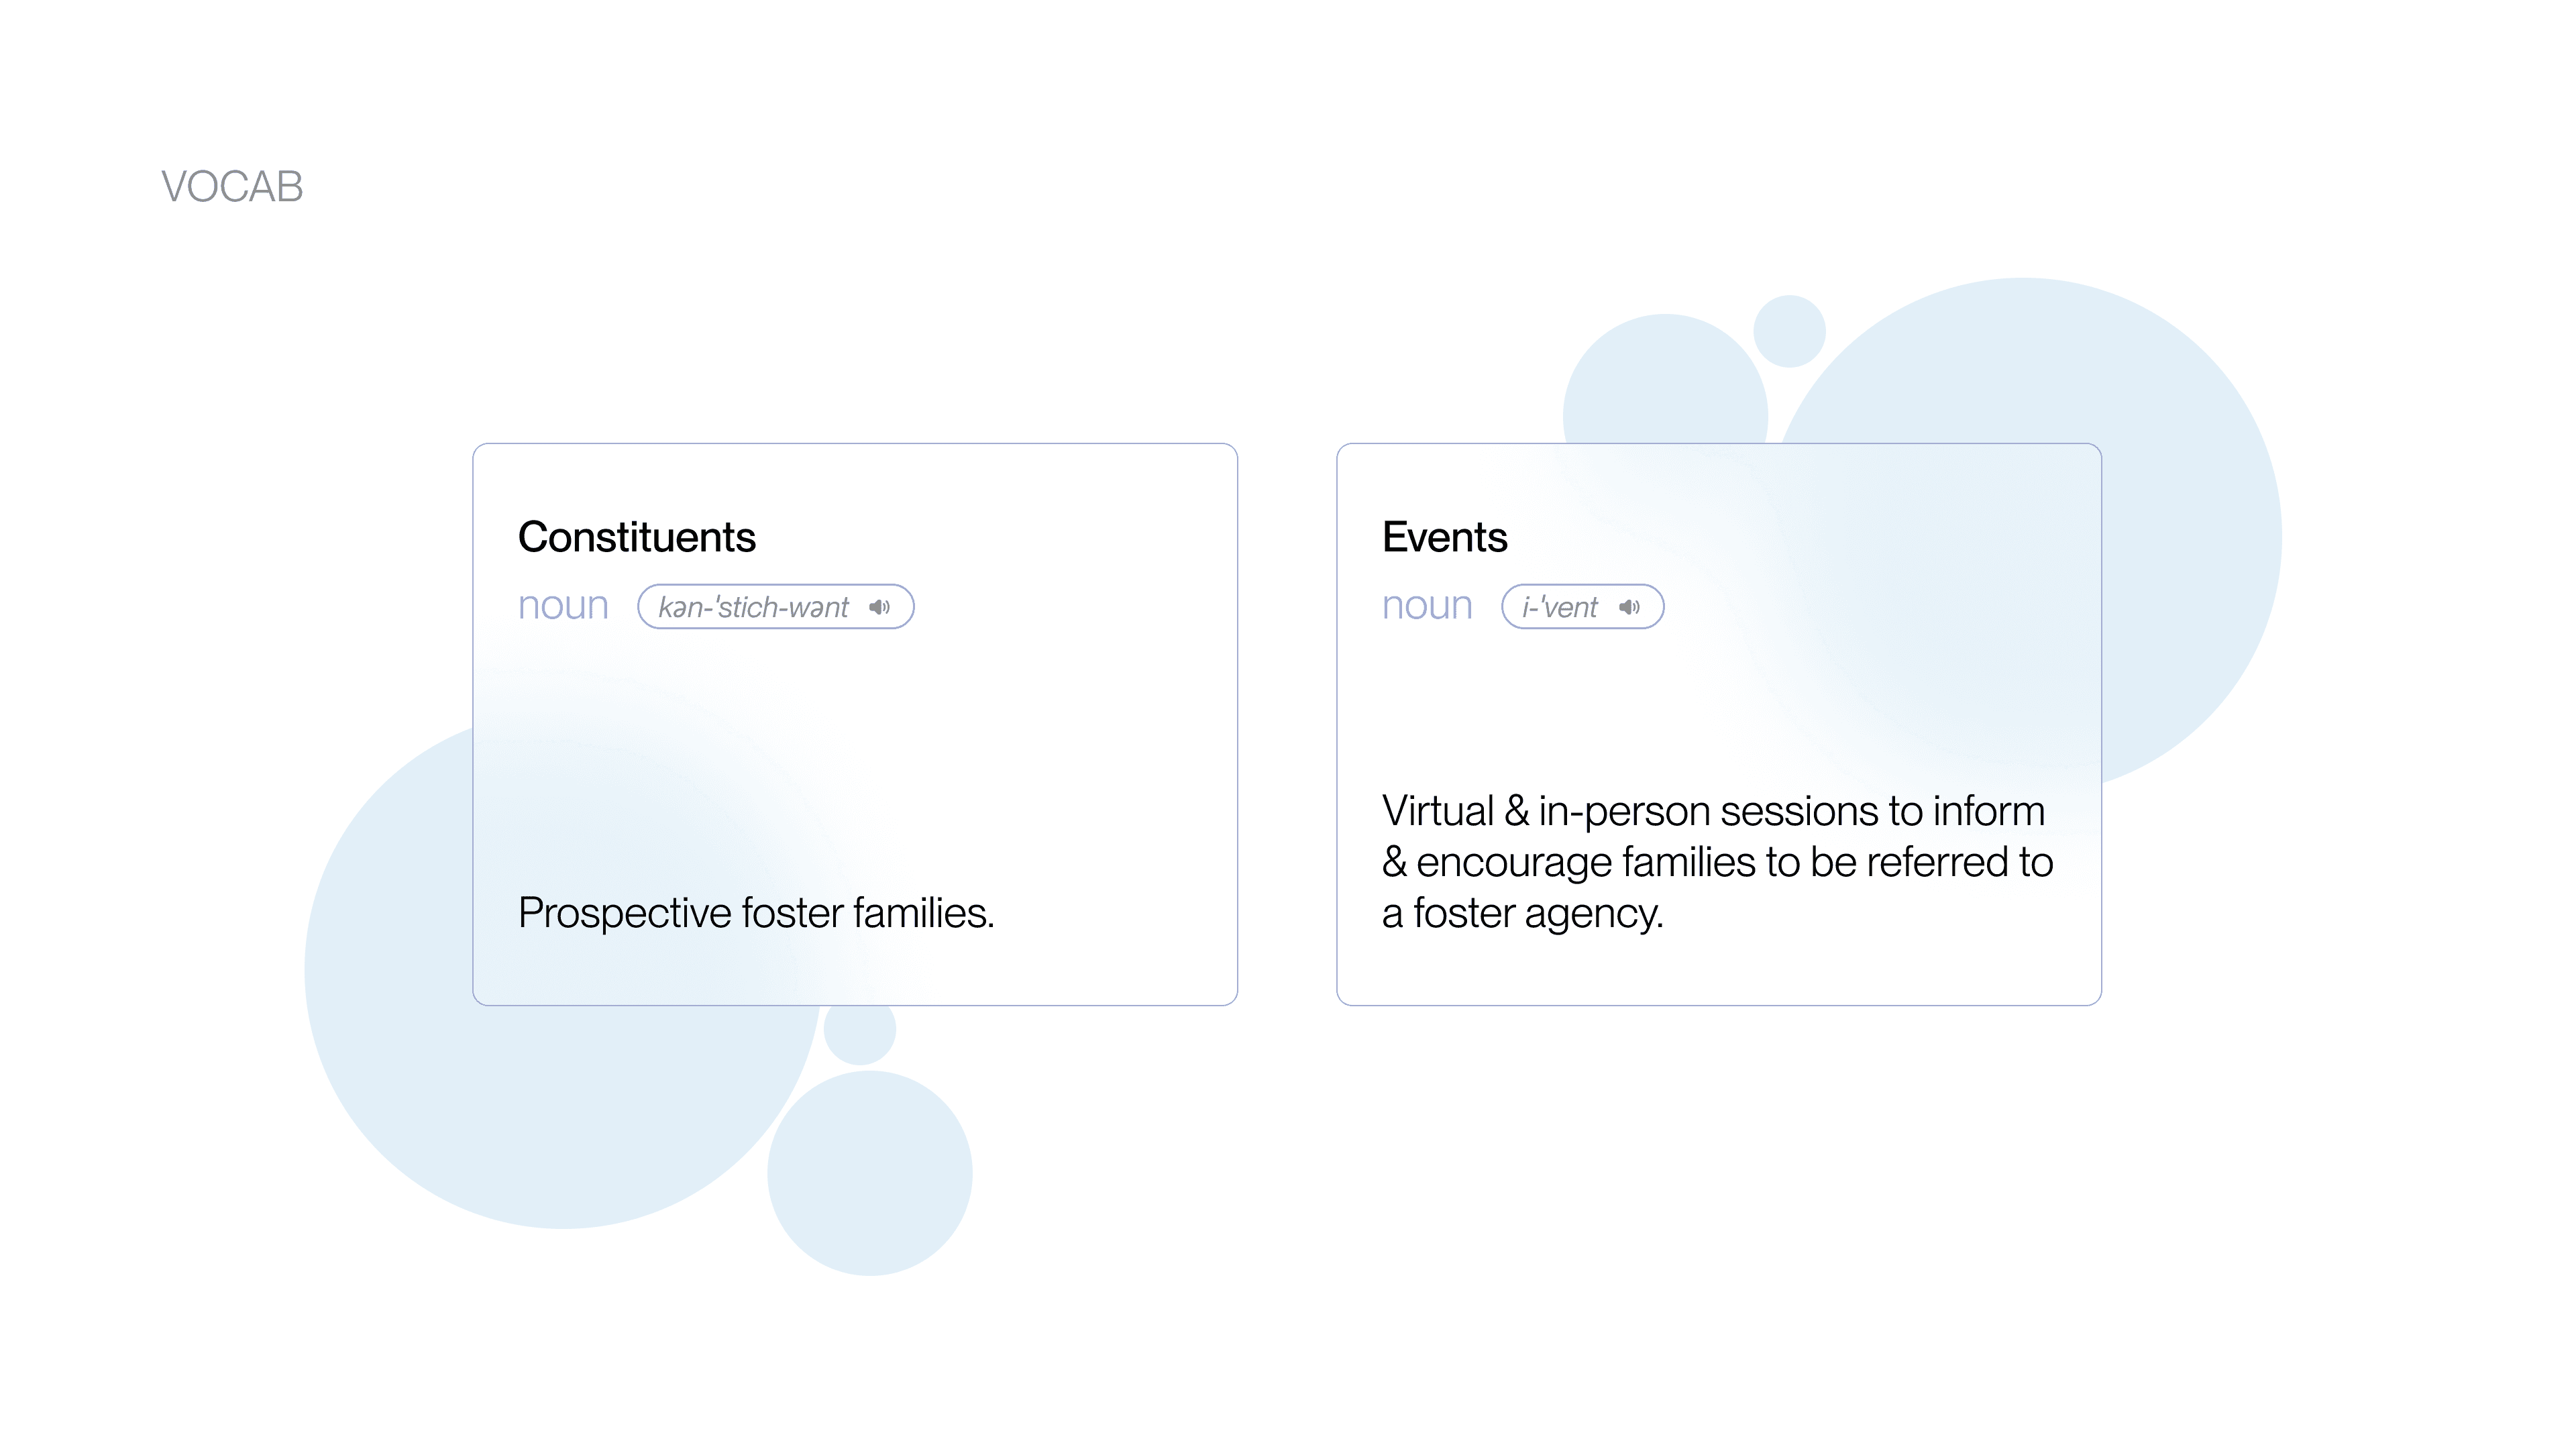
Raise a Child is a national nonprofit organization committed to serving the needs of children in foster care. The nonprofit has significantly grown over the past 12 years, increasing the number of foster events and parents/foster children supported, which has drastically increased the complexity of managing these events. The current system relies on spreadsheets which are difficult to manually keep up to date,
Our team's goal was to create a data visualization dashboard that would serve as a hub for managing all foster events and constituents. The dashboard would allow for easy, efficient communication between admins and stakeholders, saving time on both ends and enabling more efficient management of foster events.
ROLE
Product Designer
(Sept 2023 - Apr 2024)
TEAM
1 Co-Designer
1 Product Manager
1 Tech Lead
6 Developers
TOOLKIT
Figma
FigJam
SKILLS
UX/UI Design
UXR
Rapid Prototyping
Designing a data dashboard for nonprofit admins
PRO BONO PROJECT
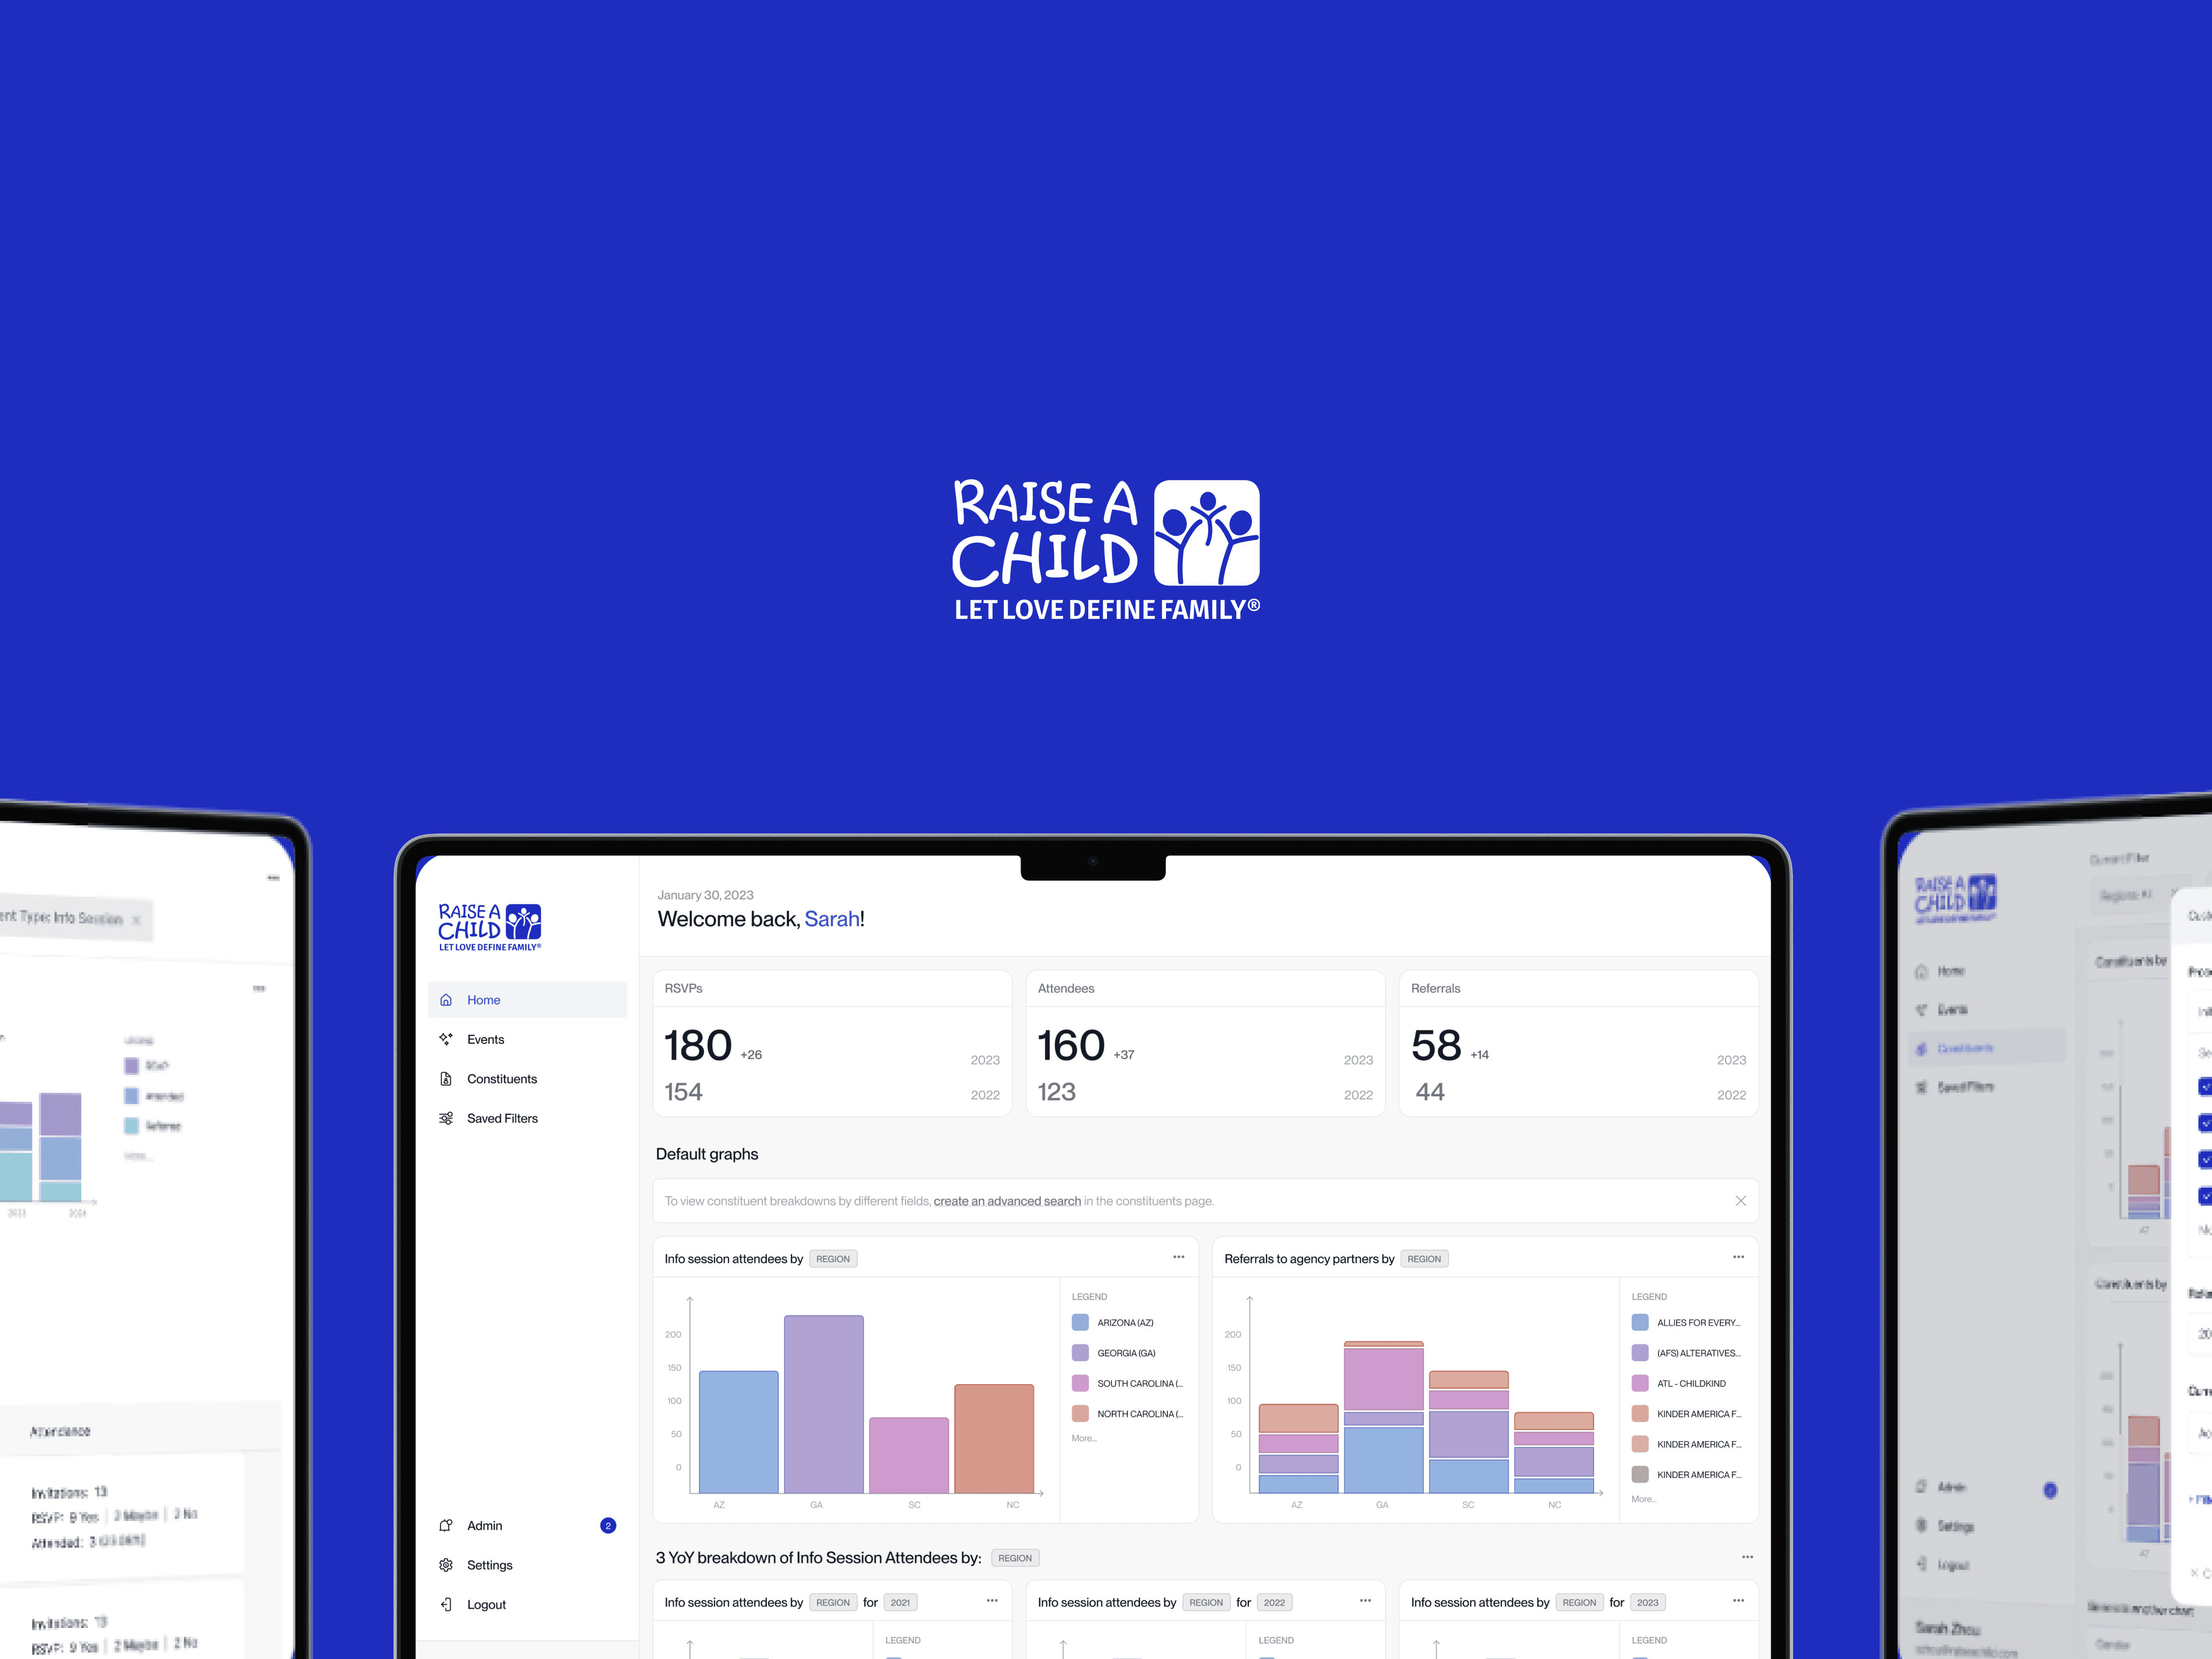
Product Preview

FILTER BY
Search with Contextual Filters
Customizable filter options for constituents and events allow users to easily navigate and analyze their data. Users can filter by various properties, such as age, location, and engagement level, making it simple to find specific groups or events. Additionally, users have the ability to save, edit, and name their filters, ensuring a personalized and efficient data retrieval process.

DATA SUMMARIES / BREAKDOWNS
Editable & Exportable Data Summaries
Users can generate three-year summaries, as well as summaries based on specific dates, events, or selected properties for both events and constituents. This flexibility allows users to see trends over time and gain insights into their outreach efforts. Furthermore, the interface supports viewing multiple property data at once, enabling a comprehensive analysis that facilitates informed decision-making.
Jump to design solution?
problem space
Raise A Child has access to extensive constituent and event data, but effectively visualizing the performance of their family outreach and events presents a challenge. When presenting to board members or applying for grants, clear visual representations of organizational performance are crucial for demonstrating impact.
Defining the Problem
THE ASK
Create a dashboard for the Raise a Child team members to visualize constituent outreach and event performance data with automatic graph generation.
THE BREAKDOWN
Difficult to visualize event performance and constituent demographics
Current methods like Excel are manual and do not support real-time updates
Design Process
Stakeholder Interviews
Moodboarding
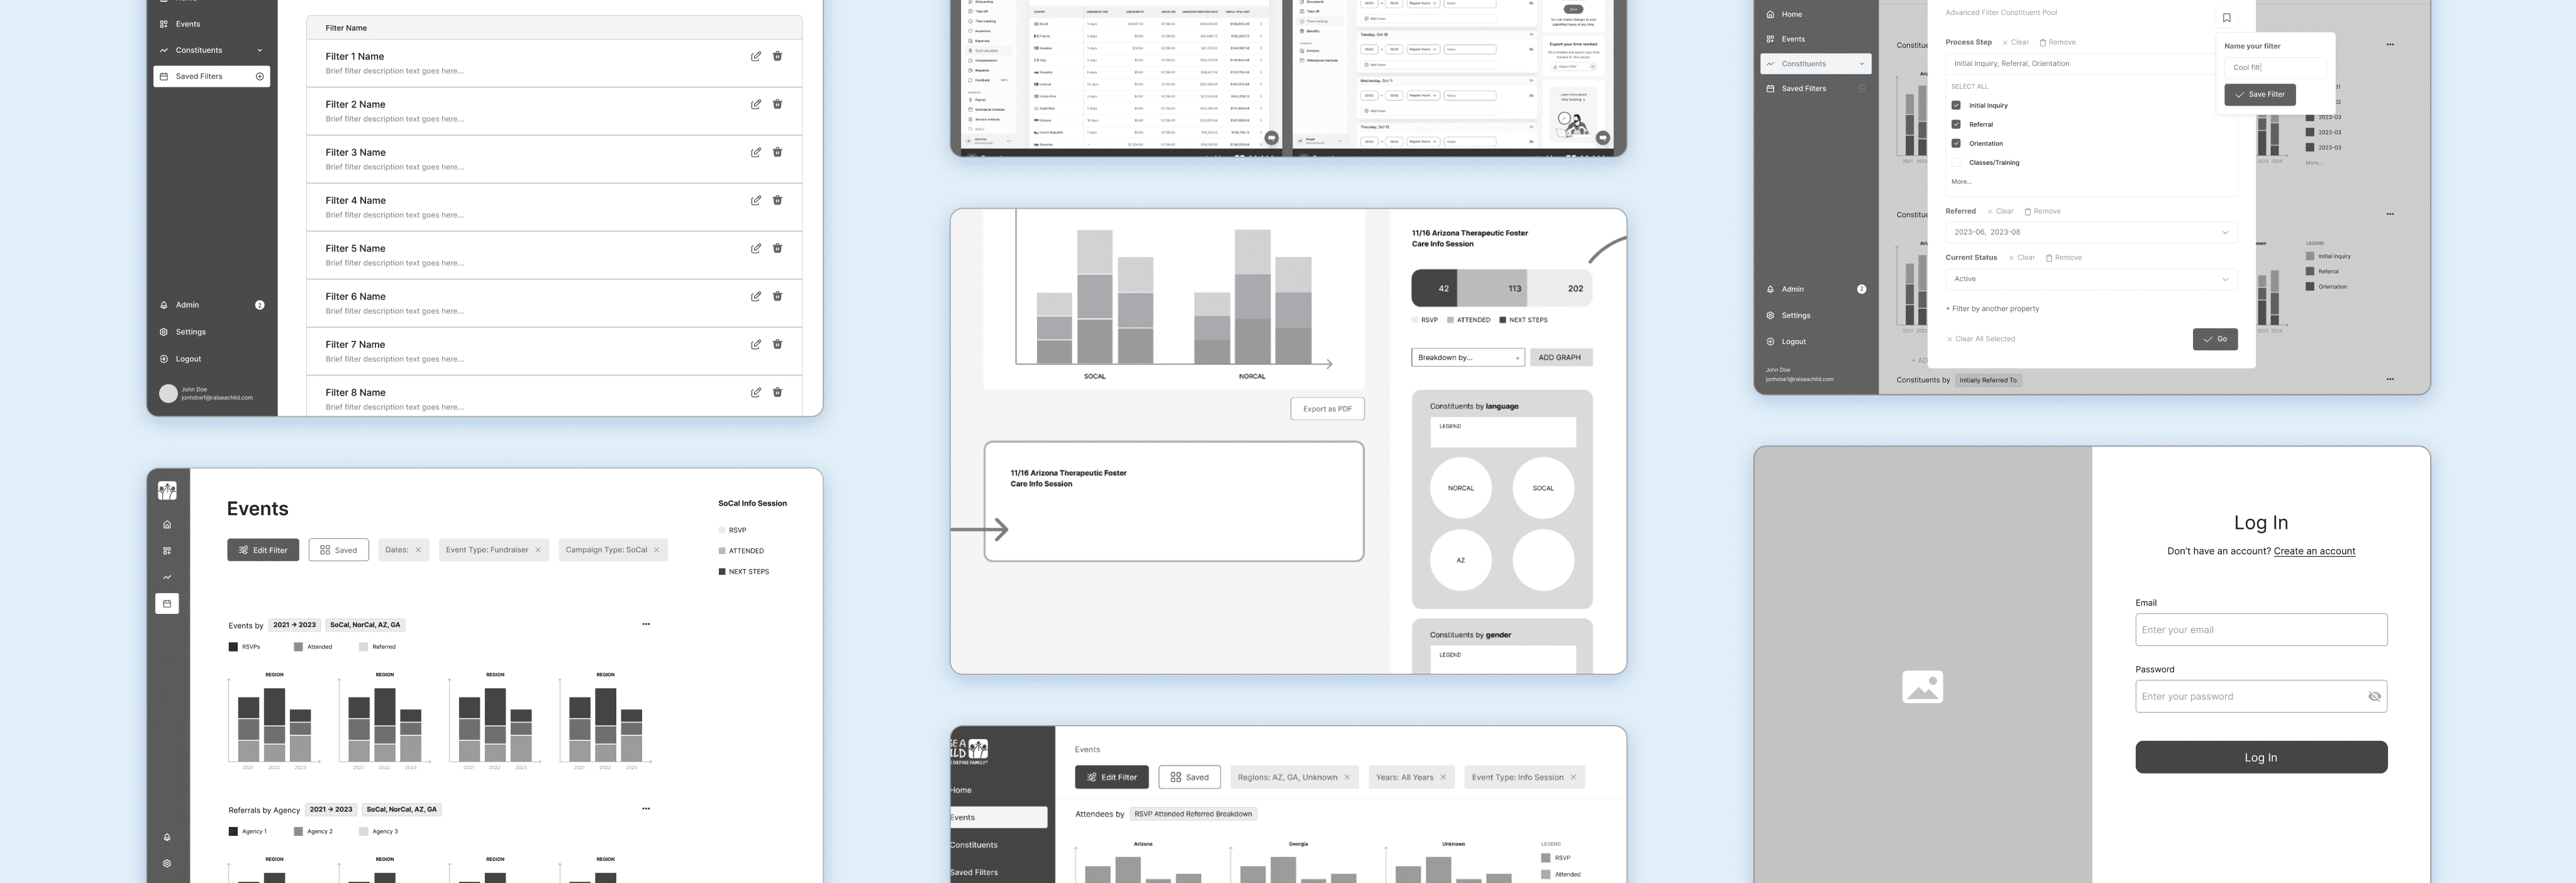
Low-Fidelity Designs
High-Fidelity Designs
Multiple rounds of iteration based on client feedback
Ideation & iterations
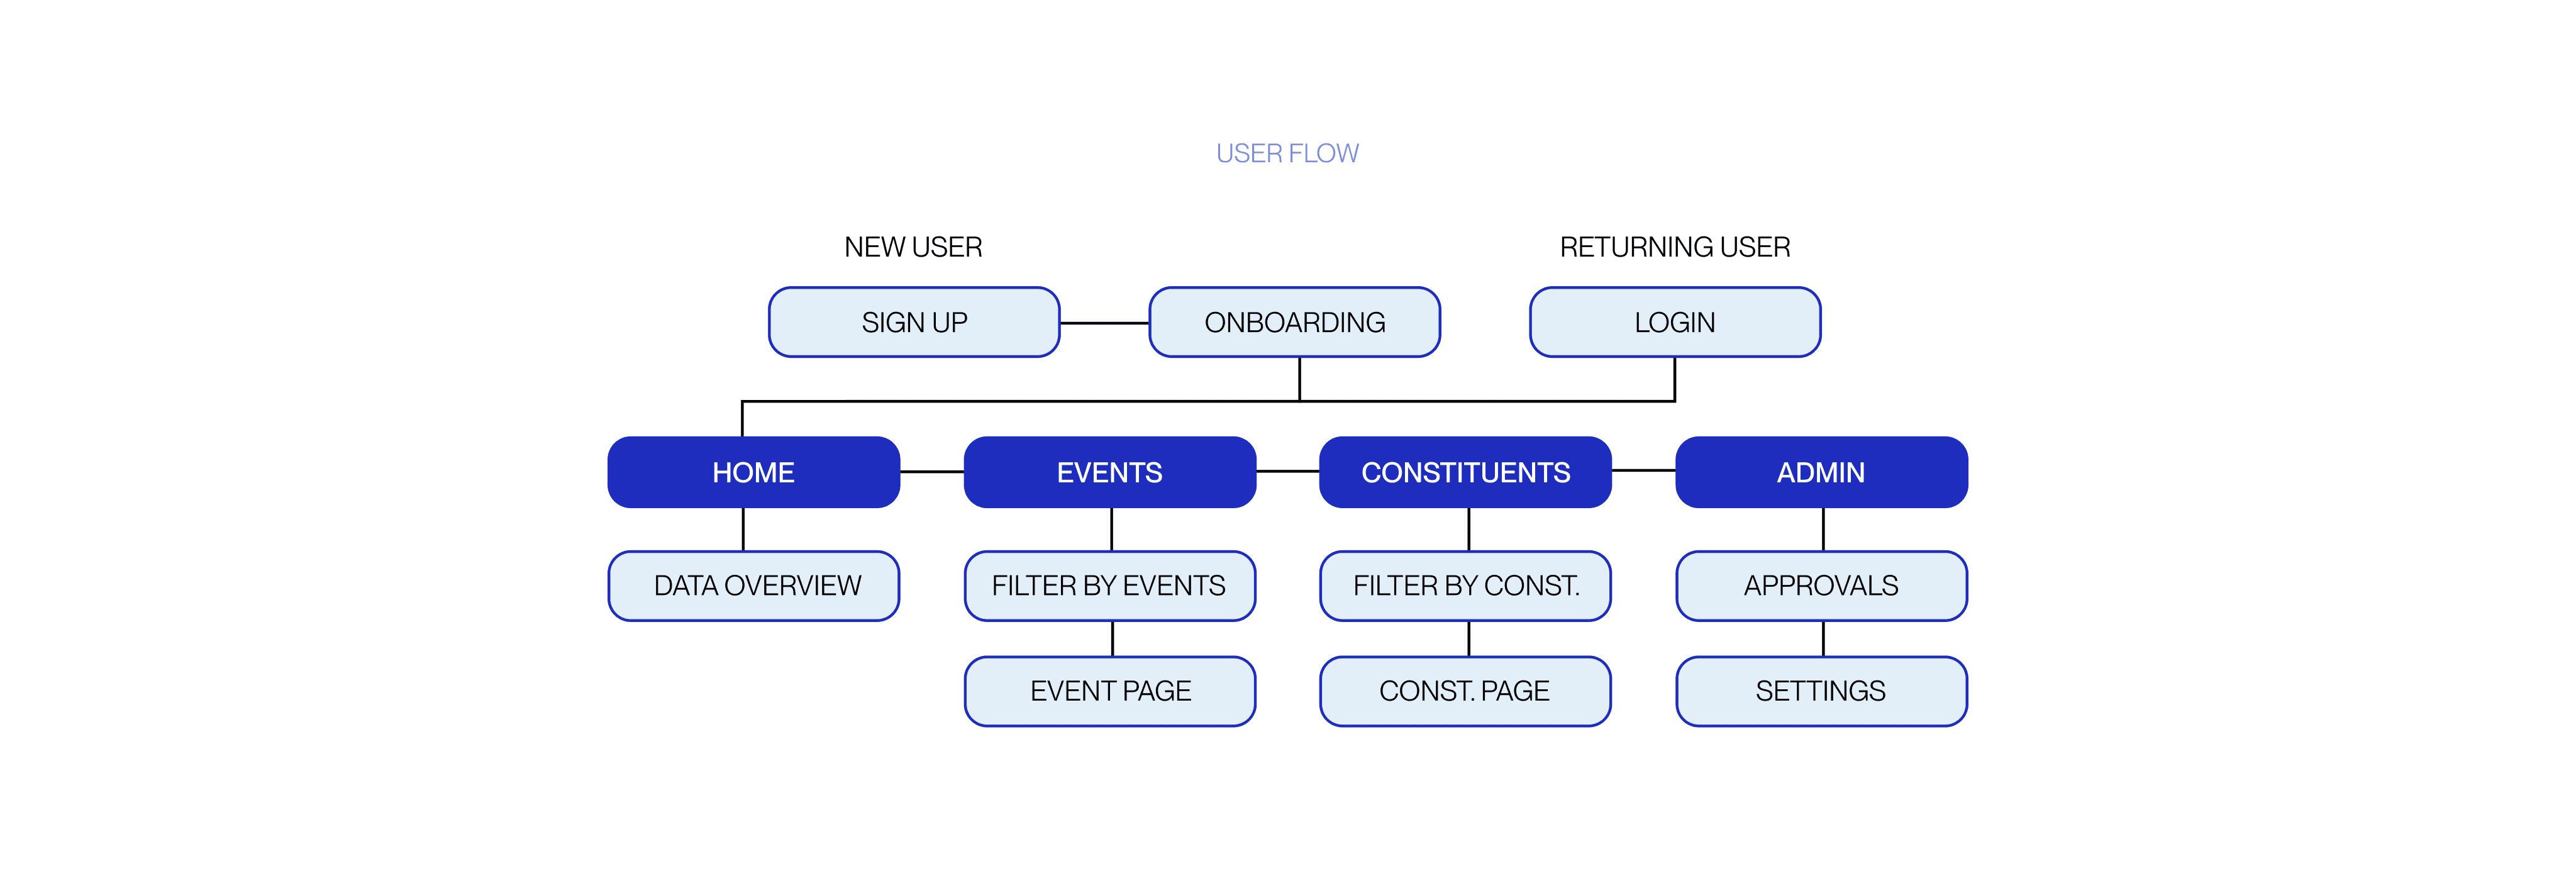
In the ideation phase, the goal was to refine the user flow for Raise A Child's data visualization tools. Brainstorming sessions alongside client meetings highlighted key user needs, such as intuitive navigation and quick access to important metrics. Several layout options were created for discussions with clients and stakeholders. These included different dashboard views and customizable graph formats, making it easier for users to visualize their data effectively.
SECURITY FEATURES
Key features were also added to enhance functionality. An admin approval process was introduced to improve security, ensuring that sensitive information is accessible only to authorized users.
EXPORTS AND FILTERS
The option to export data as PDFs was implemented for easy report generation, and additional filter options were included to streamline data access and management.
Final Screens and Assets
Main Screens
Data

Defining Meaning
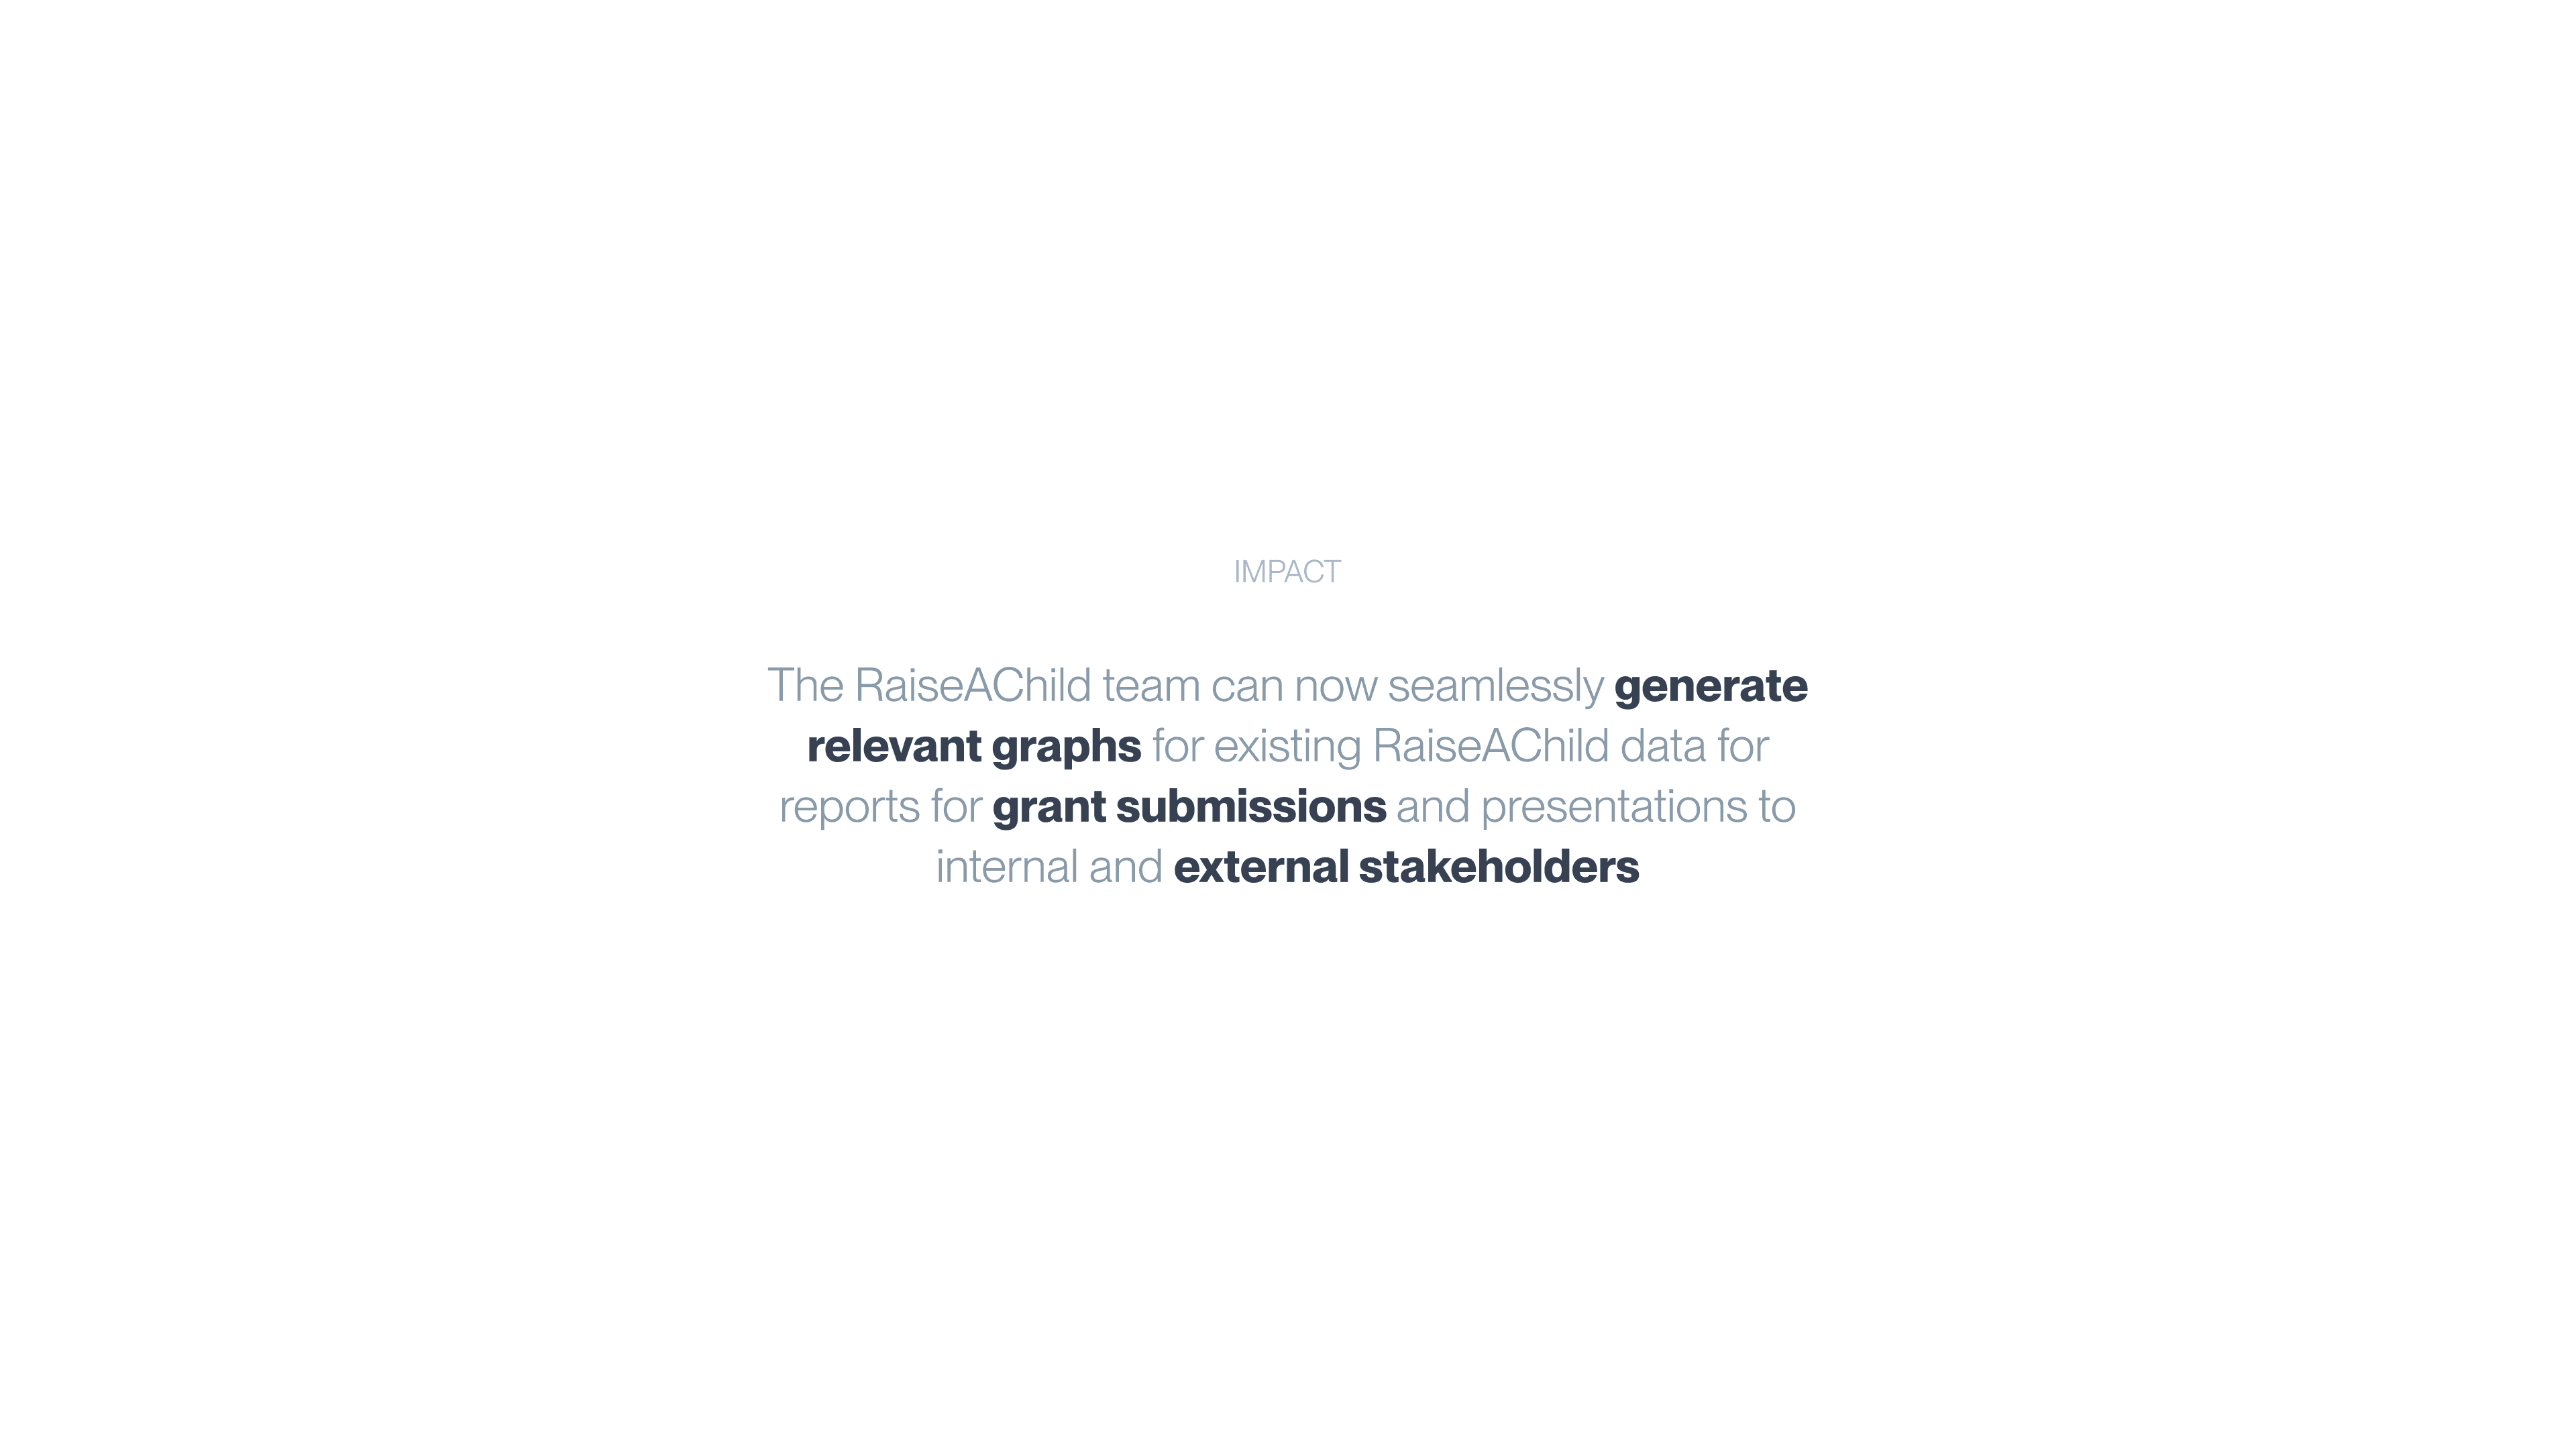
This also means that by improving their data visualization capabilities, the Raise A Child team can more effectively showcase their outreach efforts and successes. This enhanced ability to generate insightful reports will not only support grant submissions and presentations but also highlight the organization's commitment to educating and empowering families in their fostering journey.
Lessons Learned
Provide context (non-designers)
I learned the importance of putting together visuals and slide decks as well as writing down topics to remove the barrier between designers and non-designers.
Embrace ambiguity
I honed the skill of striking a balance between creative design exploration and feasible implementation. This allowed me to understand how designs might fit within the team and understand how my insights could impact the needs and goals of nonprofit admins.
